Nouvelle étude sur la mortalité : accepter l’incertitude
Par Tulio Walles, FICA, FSA | Murray Wright, FICA, FFA | Ian Zinck, FICA, FSA
Perspectives – janvier 2025
Dans notre article précédent, nous avons fourni des renseignements sur l’incidence potentielle d’une nouvelle étude canadienne sur l’amélioration de la mortalité (AM) publiée en avril 2024 par l’Institut canadien des actuaires (ICA).
L’étude recommande une échelle d’AM et souligne que « notre analyse montre que le meilleur estimé des taux d’amélioration à long terme [est sujet] à une grande incertitude… ». Cette observation est conforme aux directives actuarielles existantes, notamment la Note éducative de l’ICA sur la Sélection des hypothèses de mortalité aux fins des évaluations actuarielles des régimes de retraite, qui constate que « les hypothèses relatives aux taux d’amélioration future de la mortalité sont tout de même assorties d’un degré élevé d’incertitude et font l’objet de grands débats ».
Dans ce nouvel article de notre série de trois articles sur la nouvelle étude de l’ICA sur la mortalité, nous discuterons des incidences potentielles de cette incertitude sur les régimes de retraite et d’avantages sociaux. Bien que cet article n’ait pas pour but de formuler des conseils sur la sélection d’une hypothèse adéquate sur l’AM, notre objectif est de fournir des renseignements fondés sur la recherche afin d’orienter le processus de prise de décision. Nous examinerons les éléments relatifs à l’établissement d’une hypothèse d’AM adéquate dans un article à venir.
Un intervalle raisonnable
L’étude recommande un taux d’AM à long terme de 1,3 %. Cela signifie qu’à long terme, les taux de mortalité diminueront de 1,3 % par an et que, par conséquent, l’espérance de vie augmentera. Le taux d’AM à long terme de 1,3 % figurant dans l’étude a été déterminé en appliquant des modèles aux données historiques de la population canadienne et en projetant ces modèles dans l’avenir. Il convient de noter qu’il s’agit d’un changement de méthode par rapport à l’approche utilisée avec les échelles d’AM existantes au Canada, qui s’appuient largement sur le jugement d’experts.
L’étude indique également qu’« une fourchette raisonnable pour l’hypothèse d’AM à long terme… se situe entre 1,0 % et 1,9 % ». Le fait que les chercheurs aient inclus des fourchettes explicites dans le document est digne de mention, car cela souligne le fait que bien que le taux à long terme recommandé sur la base des données historiques de la population canadienne soit de 1,3 %, une série d’hypothèses alternatives est plausible. Cela démontre également combien il est difficile d’élaborer une hypothèse d’amélioration de la mortalité. Même avec des données portant sur des dizaines de millions de Canadiens, utiliser le passé pour prédire l’avenir est un exercice difficile et incertain.
Il est important de noter qu’une échelle d’amélioration de la mortalité n’est finalement qu’une hypothèse. Dans la pratique, les améliorations de la mortalité à long terme pourraient être considérablement supérieures ou inférieures aux attentes. Cet article traite la fourchette proposée afin d’établir une hypothèse d’amélioration de la mortalité de meilleure estimation appropriée et les raisons pour lesquelles la sélection d’une échelle d’amélioration de la mortalité qui prédit une espérance de vie plus longue augmente les chances que les passifs n’aient pas été sous-évalués, et vice-versa.
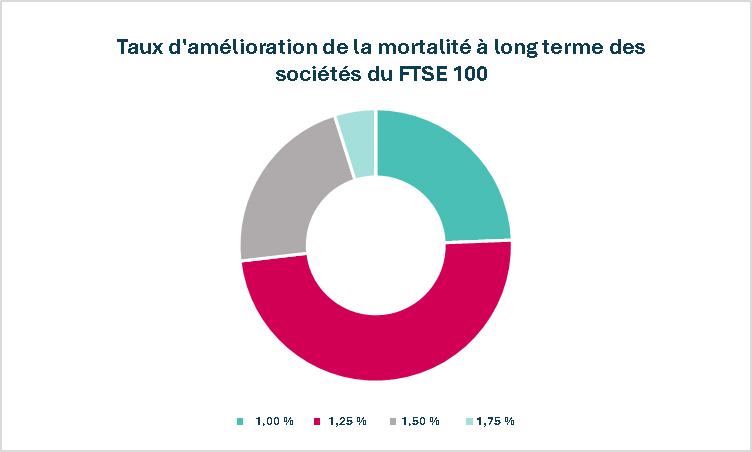
À notre avis, la fourchette proposée entre 1,0 % et 1,9 % semble raisonnable. Elle est généralement cohérente avec l’éventail d’hypothèses utilisé par les régimes de retraite britanniques, qui doivent choisir leur propre taux d’AM à long terme dans le cadre de l’établissement de leurs hypothèses (voir le graphique ci-dessous) :

Source : rapports annuels du FTSE 100.
Aux fins du présent article, nous proposons de ramener la limite inférieure de la fourchette de 1,0 % à 0,8 % afin d’inclure le taux d’AM à long terme utilisé sous l’échelle CPM-B, qui constitue actuellement l’hypothèse d’AM la plus couramment utilisée par les régimes de retraite canadiens.
Quelle serait l’incidence de l’adoption d’un taux d’AM à long terme compris entre 0,8 % et 1,9 % sur les régimes de retraite?
| Augmentation approximative de l’espérance de vie à 65 ans1 pour une personne de 65 ans | |||||
| CPM-B | MI-2017 | MI-CAN-2024 [0,8 %] | MI-CAN-2024 [1,3 %] | MI-CAN-2024 [1,9 %] | |
| Taux d’AM à long terme | 0,80 % | 1,00 % | 0,80 % | 1,30 % | 1,90 % |
| Hommes | – | + 0,3 an | + 0,8 an | + 1,1 an | + 1,6 an |
| Femmes | – | + 0,5 an | + 1,0 an | + 1,4 an | + 1,9 an |
1 Selon la table de mortalité de base de 2014 (CPM 2014)
Dans notre article précédent, la nouvelle échelle d’AM avait été nommée « échelle APCI », du nom de la méthode utilisée aux fins d’examen de l’incidence de l’âge, de la période et de la cohorte de l’année de naissance dans la nouvelle échelle. Dans cet article et les suivants, nous utiliserons l’appellation plus intuitive de MI-CAN-2024.
L’adoption de la nouvelle échelle MI-CAN-2024 avec un taux à long terme de 0,8 % (similaire au taux à long terme de l’échelle CPM-B) entraîne tout de même une augmentation de l’espérance de vie à 65 ans, et donc du passif des régimes. Cela montre que si le taux d’AM à long terme est l’un des principaux facteurs susceptibles d’influencer les résultats, d’autres différences liées aux échelles (notamment les choix de modèles spécifiques et l’utilisation de données plus récentes) ont également une incidence importante.
L’adoption de la nouvelle échelle d’AM avec un taux d’AM à long terme de 1,9 % mène à des augmentations significatives de l’espérance de vie, même dans le cas des participants actuellement âgés de 65 ans.
| Augmentation approximative de l’espérance de vie à 65 ans1 pour une personne âgée de 45 ans | |||||
| CPM-B | MI-2017 | MI-CAN-2024 [0,8 %] | MI-CAN-2024 [1,3 %] | MI-CAN-2024 [1,9 %] | |
| Taux d’AM à long terme | 0,80 % | 1,00 % | 0,80 % | 1,30 % | 1,90 % |
| Hommes | – | + 0,7 an | + 1,2 an | + 2,3 ans | + 3,6 ans |
| Femmes | – | + 0,9 an | + 1,4 an | + 2,4 ans | + 3,6 ans |
1 Selon la table de mortalité de base de 2014 (CPM 2014)
La principale observation découlant des résultats ci-dessus est que l’incidence des différents taux à long terme est beaucoup plus importante chez les participants plus jeunes. Cela était attendu, car plus la personne est jeune, plus elle est susceptible d’être exposée à des améliorations de la mortalité de plus grande envergure au cours de sa vie et plus l’incidence sur son espérance de vie sera importante.
Si nous transposons cette observation à l’échelle du régime, le choix du taux d’AM à long terme aura une incidence plus importante sur les régimes moins matures et sur le « coût du service courant », qui ne prend en compte que les participants actifs, par rapport au passif total du régime, qui inclut les retraités.
Incidence sur les passifs
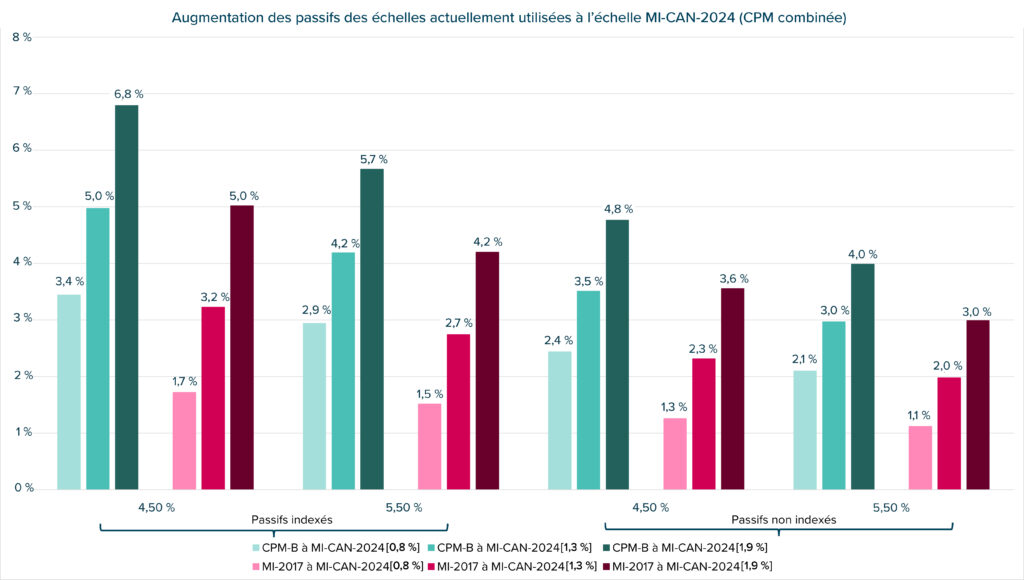
Le graphique ci-dessous montre l’incidence potentielle du remplacement d’une échelle d’AM actuelle (soit CPM-B ou MI-2017) par la nouvelle échelle MI-CAN-2024 selon différents taux d’amélioration à long terme pour un régime de retraite hypothétique¹. Les incidences sont présentées avec et sans indexation post-retraite, et avec des taux d’actualisation de 4,50 % et de 5,50 %.

Il est intéressant de noter que l’incidence de l’adoption de la nouvelle échelle avec un taux d’amélioration à long terme de 0,8 % (équivalent à celui utilisé sous l’échelle CPM-B) représente plus de la moitié de la variation des passifs. Une fois de plus, cela souligne que le choix du taux d’amélioration à long terme ne représente qu’un facteur parmi d’autres.
Comme nous l’avons indiqué précédemment, l’incidence réelle de l’adoption du nouveau modèle dépendra des caractéristiques du régime concerné. Par exemple, l’incidence sera plus importante pour un régime dont la proportion de participants actifs est plus élevée que pour celui dont la proportion de participants retraités est plus élevée. Pour connaître l’incidence réelle de l’adoption de la nouvelle échelle pour votre ou vos régimes, votre actuaire devra faire les calculs.
La « courbe » de la mortalité
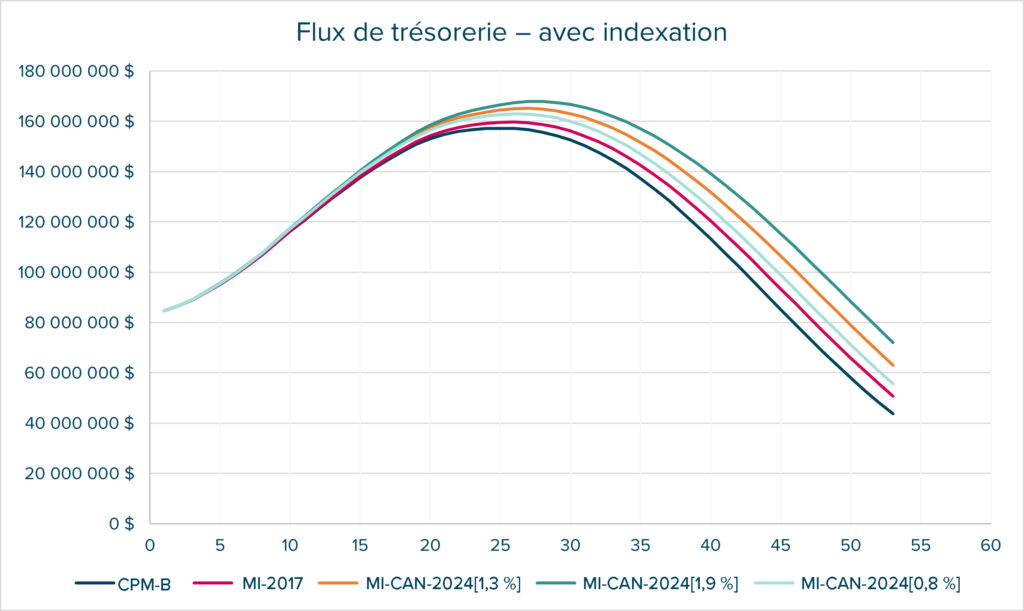
Au-delà des principaux chiffres, il est intéressant d’examiner également la « courbe » de la mortalité. Un certain temps est nécessaire pour que l’incidence des améliorations de la mortalité se concrétise, car celle-ci s’accentue à mesure que les participants vieillissent. Le graphique ci-dessous montre l’incidence de différentes hypothèses de mortalité sur les flux de trésorerie liés aux prestations attendus pour un régime de retraite hypothétique1.

Cela montre que même si l’incidence sur l’espérance de vie et le passif des régimes est relativement faible, l’incidence sur les flux de trésorerie du régime sous-jacents pourrait être plus importante. Dans le cadre de ce régime hypothétique, les flux de trésorerie attendus au cours des 100 prochaines années sont de 6,3 milliards de dollars selon l’hypothèse d’échelle CPM-B et de 7,4 milliards de dollars selon l’hypothèse d’échelle MI-CAN-2024 avec un taux d’amélioration à long terme de 1,9 %. Si le taux d’amélioration de 1,9 % se confirmait dans la pratique, le milliard de dollars « supplémentaire » devrait être financé par des rendements de placement futurs ou par des cotisations supplémentaires. Cela nous montre que l’hypothèse utilisée peut avoir des conséquences et doit être soigneusement étudiée aux fins de toute prise de décision stratégique et que la modélisation actif-passif, y compris dans le cadre de simulations de crises et de divers autres scénarios, est nécessaire à la compréhension de l’incidence potentielle.
Nous pensons qu’il est important de reconnaître l’existence d’un certain niveau d’incertitude et que nous pouvons ainsi mieux comprendre, surveiller et gérer le risque de longévité, quelle que soit l’hypothèse adoptée dans la pratique. L’ICA a également mis à jour la Note éducative sur la sélection des hypothèses de mortalité afin d’indiquer que toute échelle disponible (CPM-B, MI-2017 ou la nouvelle échelle MI-CAN-2024) peut être utilisée en l’absence d’autres renseignements crédibles. Toutefois, les régimes de retraite et d’avantages sociaux devraient tenir compte de l’éventail d’hypothèses plausibles et de l’incidence résultante sur le régime si ces scénarios devaient se confirmer. Certains régimes pourraient envisager d’adopter différentes hypothèses d’AM à long terme dans le cadre d’utilisations spécifiques, y compris pour leurs états financiers. Nous continuerons à explorer ces sujets dans de futurs articles.
1 Régime fondé sur les salaires avec environ 45 % de participants actifs. Le cas échéant, l’augmentation des prestations après la retraite est de 2 % par an. Mortalité de référence basée sur la table de mortalité CPM 2014 combinée.