Why are so many global equity managers underperforming?
Global equity markets have experienced an exuberant run over the past two years. However, many institutional investors have noticed a puzzling phenomenon – their global equity managers, despite strong absolute performance, have increasingly trailed the benchmark. If you’ve noticed this in your own portfolio, you’re not alone.
Over half of all global equity managers underperformed the benchmark index in 2023, and more than 2/3 have underperformed in 2024 – the highest percentage in over two decades.
Why are so many global equity managers underperforming? In Part 1 of this two-part series, we explore some of the factors driving this phenomenon.
US equities represent nearly 2/3 of global equity market capitalization
At first glance, the MSCI All Country World Index (ACWI) appears to be a broadly diversified portfolio of global stocks. The more than 2,600 companies in the ACWI Index span 47 developed and emerging market countries. However, far from being equally weighted, certain companies and one country in particular have become increasingly dominant drivers of performance.
Like most public equity indices, the MSCI ACWI Index is a market capitalization weighted index¹. Larger countries and companies represent a bigger share of the index and exert a greater influence on overall index return. US-listed companies account for over 66% of the ACWI index, which is more than double its country weight from 35 years ago, and over 10x the index weight of the next-largest country.
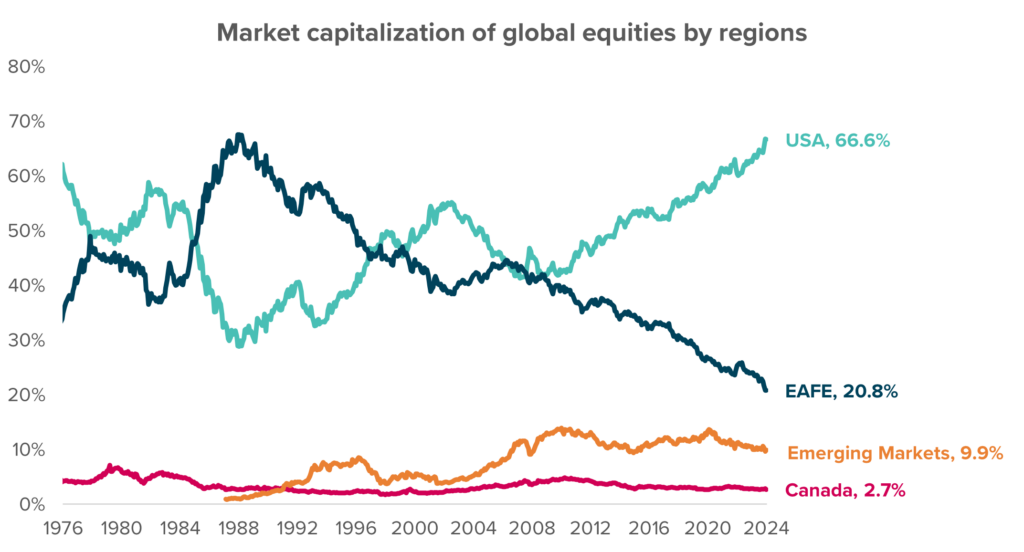
Source: LSEG, Eckler. Data as of December 31, 2024.
US equities have outperformed other regions recently
The growth in US equity weight has been driven by strong US equity performance. As the returns of US equities outpace other regions, the market capitalization of US equities has grown as a share of global market capitalization. This disparity in regional equity performance has been particularly striking over the past year. The S&P 500 Index has risen 36% in Canadian dollar terms in 2024, 14% more than the 22% returned by Canadian equities, and more than twice the return of international equities over the same period.
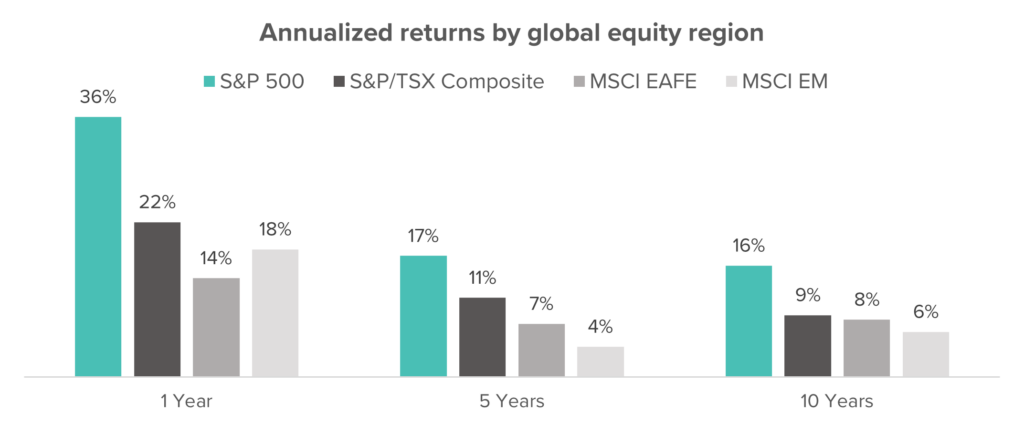
Source: eVestment, Eckler. Data as of December 31, 2024. Returns in $C and gross of dividend withholding tax.
Many active managers are underweight US equities
Based on a universe of over 500 global equity strategies², over half of active managers were underweight US equities relative to the MSCI ACWI Index, and a quarter of managers were underweight US equities by more than 10%. This underweight position has weighed on benchmark-relative returns as US equity returns have outpaced other global equity regions.
Active managers commonly cite valuation concerns as one reason for underweighting US companies. Valuation measures such as Price to Earnings and Price to Book are significantly higher for US equities than for other regions, while the Dividend Yield is significantly lower.
| S&P 500 | S&P/TSX Composite | MSCI EAFE | MSCI Emerging Markets | |
| Price / Earnings (Trailing) | 28.8 | 21.5 | 15.1 | 15.4 |
| Price / Earnings (Forward) | 24.6 | 16.5 | 13.8 | 11.9 |
| Price / Book | 5.0 | 2.1 | 1.9 | 1.8 |
| Dividend Yield | 1.3% | 2.9% | 3.1% | 2.6% |
Source: MSCI, S&P, Eckler. Data as of December 31, 2024.
Strong US equity index performance is driven by a small group of companies
One important factor in the US outperformance story is the fact that that a relatively small number of US companies have accounted for a large proportion of total index return. Over half of the S&P 500 return over the past two years has been driven by just 7 US companies³, known as the Magnificent 7.
The Magnificent 7 have experienced an average cumulative return of 268% since January 2023, compared to a cumulative return of 68% for the overall S&P 500 Index over the same period. The higher Magnificent 7 returns have been driven in part by higher valuations – the trailing Price/Earnings ratio for the Magnificent 7 averages 48, compared to a Price/Earnings ratio of 29 for the overall S&P 500 Index.
|
Cumulative Price Return
|
Price/Earnings Ratio | |
| NVIDIA (NVDA) | 819% | 53 |
| Meta (META) | 387% | 29 |
| Tesla (TSLA) | 228% | 111 |
| Amazon (AMZN) | 161% | 47 |
| Alphabet (GOOG, GOOGL) | 115% | 25 |
| Apple (AAPL) | 93% | 39 |
| Microsoft (MSFT) | 76% | 34 |
| S&P 500 Index | 68% | 29 |
Source: eVestment, Nasdaq, Eckler. Trailing P/E as of January 14, 2025.
Enthusiasm for artificial intelligence has benefited certain stocks
Many of the top companies share a common theme: they are beneficiaries of the artificial intelligence boom ignited by the launch of ChatGPT in November 2022. NVIDIA is the poster child of the AI craze, as a supplier of AI hardware and software that has risen from just over 1% of the S&P 500 Index at the end of 2022 to over 6% by mid-2024.
The growth of NVIDIA and similar AI-powered names has led to the S&P 500 Index becoming more top-heavy over recent years, with the weight of the top 10 stocks now constituting nearly 40% of the index – the highest degree of concentration in over 20 years. Three companies – Apple, Microsoft and NVIDIA – each account for over 6% of the S&P 500 Index. For a sense of scale, each of these companies is larger than the entire Materials, Real Estate, Utilities, Energy or Consumer Staples sectors.
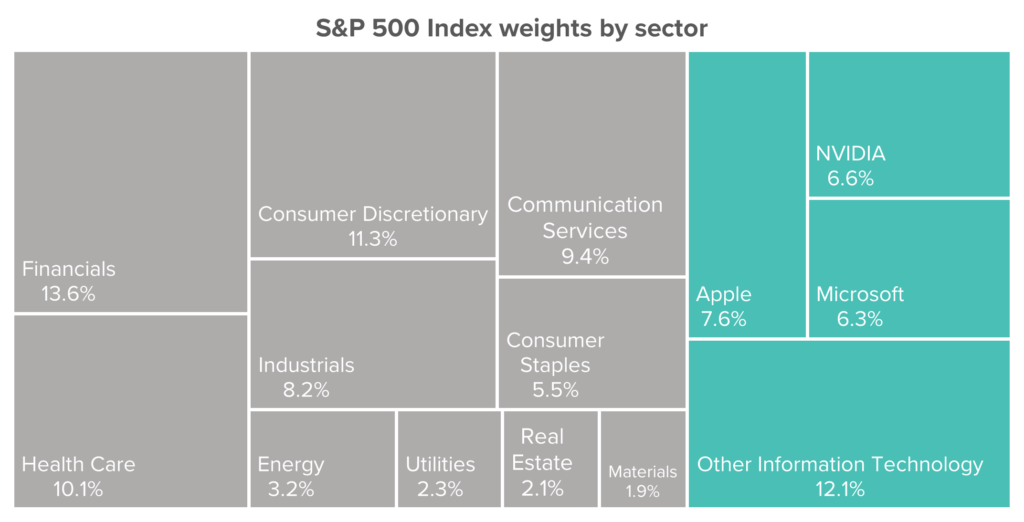
Source: eVestment, S&P, Eckler. As of December 31, 2024
Strong absolute performance, but lagging benchmark-relative performance
Equities have made strong contributions to total portfolio returns in recent years, however active managers who don’t hold the largest technology names, or who underweight these companies relative to the benchmark index, have tended to lag their benchmark over 2023 and 2024.
Concern around high valuations or the prospects for future growth are commonly cited reasons for avoiding these names. A narrow set of names has driven the index up – and could lead the index down if enthusiasm for artificial intelligence stocks wanes.
In Part 2, we review key questions that plan sponsors and asset owners should ask if they have an underperforming global equity manager in their portfolio.
1Market capitalization is the product of a stock’s price and the number of shares outstanding. Market capitalization weighted indices will therefore entail higher weights to larger companies, rather than equally weighting all constituents.
2eVestment Global Large Cap Equity universe as of September 30, 2024.
3The Magnificent 7 accounted for 63% of the S&P 500’s price return in 2023 and 55% in 2024. The same set of stocks also drove 56% of the S&P 500’s double-digit decline in 2022. Source: JP Morgan.